

What are the functions of GA4?
Google Analyst (GA4) has many uses and functions that can help website owners understand the behavior of their user groups, optimize user experience, and improve business operations. It is an essential website analysis tool for independent website operators. GA4 is not only an upgraded version of Analytics, but also a new definition of data insights. It uses more advanced machine learning technology to provide more in-depth and comprehensive user behavior analysis to help you accurately optimize advertising strategies.
- Track user behavior. GA4 tracks user behavior on the website by tracking events, including web browsing, form submission, clicks, etc., to further understand how users interact.
- Set specific goals and track conversion events. GA4 can set specific goals and track conversion events to understand users’ key interactions on the website and evaluate the degree to which business goals are achieved.
- Track the source from which users visit the website. GA4 can track the source of channels through which users access the website, such as search engines, social media and advertising, etc., and can understand the effects of different channels through data indicators.
- Provide real-time data. GA4 provides us with real-time data to instantly understand users’ latest activities and interactions.
Use GA4 to analyze traffic and user channel sources
GA4 has two important functions, one is to analyze the source of user channels, and the other is to analyze the source of traffic channels. Expand the traffic acquisition column. Through “User Acquisition Situation”, we can analyze the default channel group that brings the user’s first visit; and through “Traffic Acquisition Situation”, we can analyze the default channel group that brings the session. Unlike users, sessions are website behaviors. The same user may generate multiple sessions. Generally speaking, the total number of sessions is greater than the number of users.
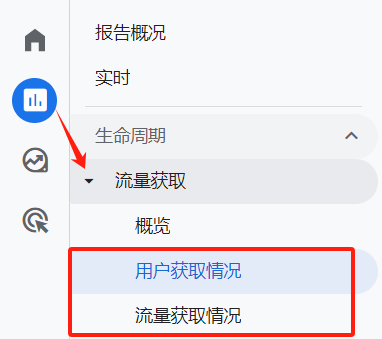
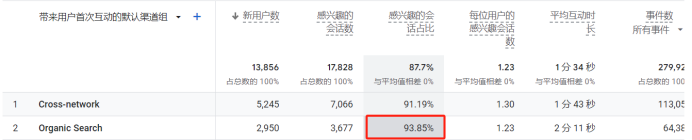
Analyze user acquisition channel sources
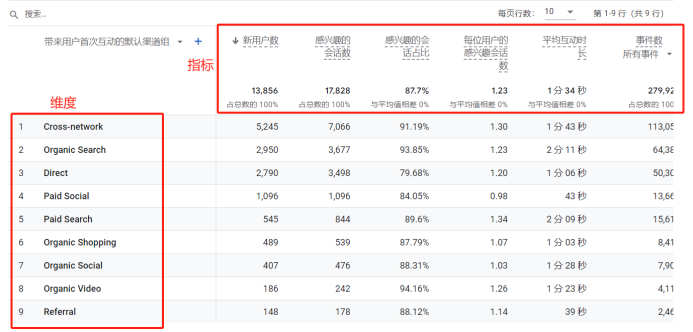
- Dimensions and indicators
Each data dialogue table is composed of dimensions and indicators. Dimensions are viewed horizontally, and indicators are viewed vertically.
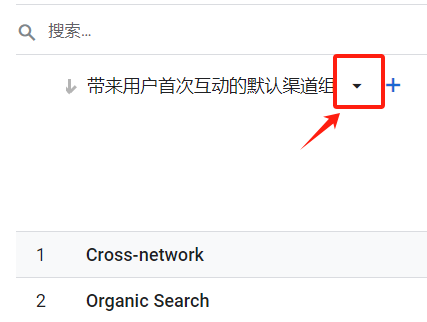
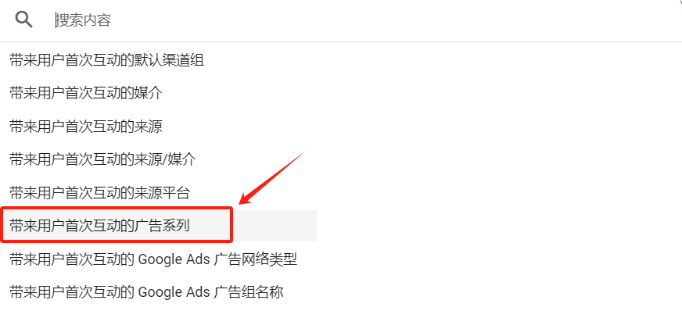
If you want to view the metrics from different dimensions, for example, if you want to view the metrics from the dimension of “Campaigns that brought the user’s first interaction,” you can click the drop-down menu at the top of the dimension bar and select the campaign that brought the user’s first interaction.
- Bounce rate
We can see that the bounce rate, which is very important in data analysis, is not seen in the indicator column. This is because there is no bounce rate in the default indicator of GA4, so the bounce rate needs to be calculated by yourself. You can use the formula: bounce rate = 1 -Percentage of interesting sessions. For example, if you want to calculate the overall bounce rate of users who come through natural search, then the bounce rate = 1-93.85% = 6.15%
- Custom indicators and dimensions
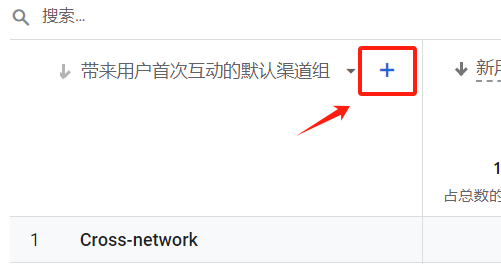
If you want to see metrics for different page paths, you can use the custom dimensions feature.
Click the + sign at the top of the dimension bar.
Then click the triangle on the right side of the web page/screen, and then select the web page path and screen class.
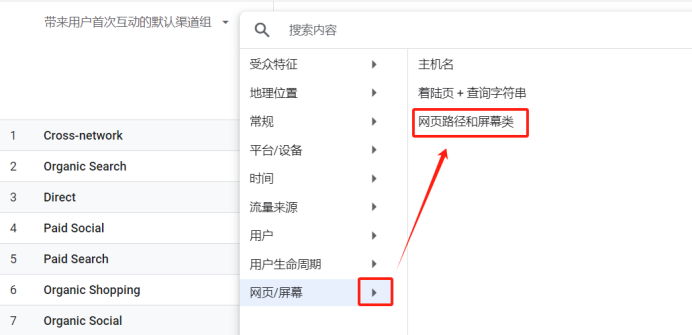
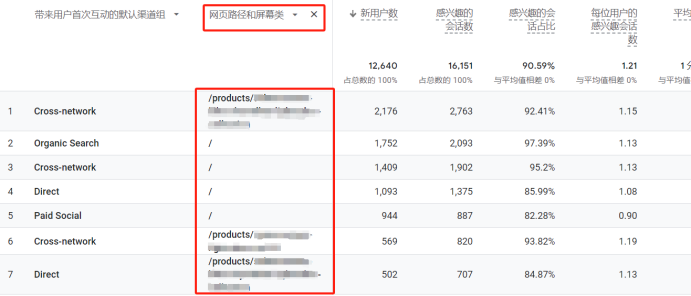
After selecting, you can see an additional dimension of “Web Page Path and Screen Class”. By adding this dimension, you can view various indicators corresponding to specific web page paths.
The methods of traffic channel analysis and user channel analysis are also the same, so we won’t go into details here.
Analyze user interactions
- Transformation
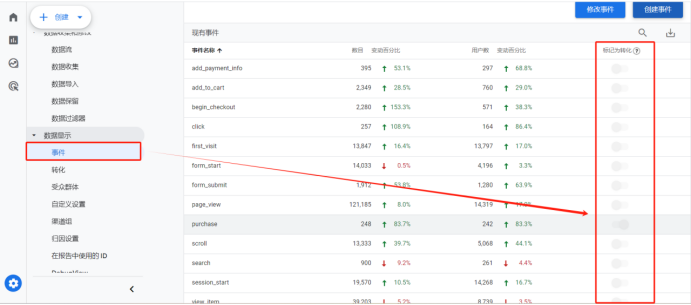
You can individually mark some events as conversions. For example, if you want to mark “purchase” as a conversion, first click “Manage” on the left side of the homepage and then click Data Display – Events. You can see that there are many events, and they are marked on the right side of the event. Conversion button. Turn on the button to mark the event as a conversion. Here, turn on the “purchase” switch.
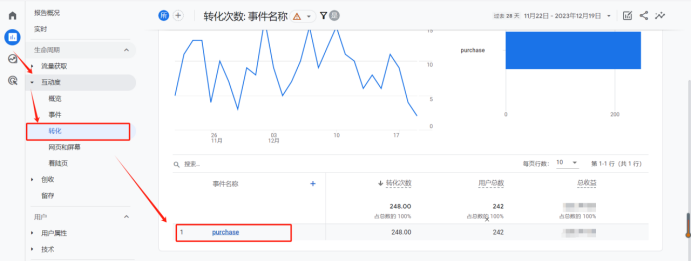
Go back to Reports-Interaction-Conversion, and you can see various purchase indicators, such as the number of conversions, total number of users, and total revenue.
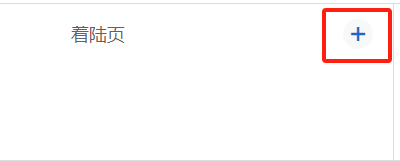
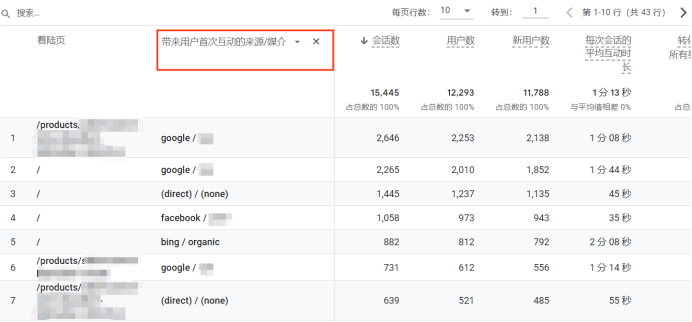
- Landing page
The landing page is the first stop for users to interact with your website. An excellent landing page can greatly increase the conversion rate. Therefore, it is necessary for us to pay attention to the data of the landing page to analyze why the landing page brings more conversions, or Why it brings so few conversions.
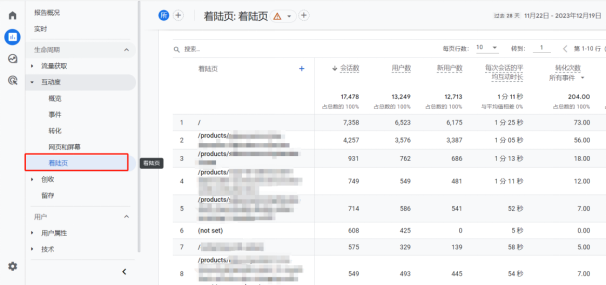
Regarding landing pages, you can focus on the top ten landing pages, what are the corresponding traffic channels, and which landing pages bring higher conversions.
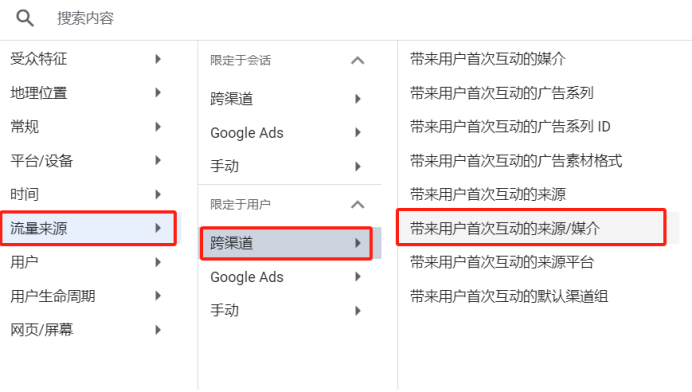
By clicking the + sign next to the landing page bar, you can add the “Source/Medium of First Interaction” dimension to view traffic channels.
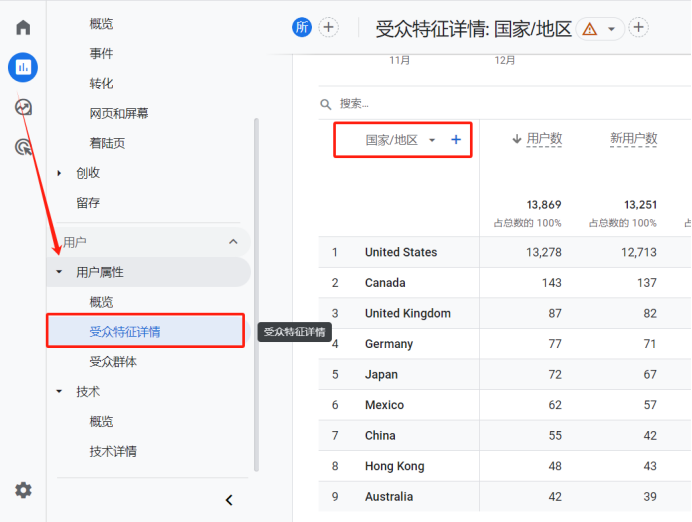
Analyze user portraits
- Through the audience characteristics details, you can analyze the indicator data of users from different countries or regions through the dimension of “country/region”, and you can also add more dimensions, such as gender, city, etc.
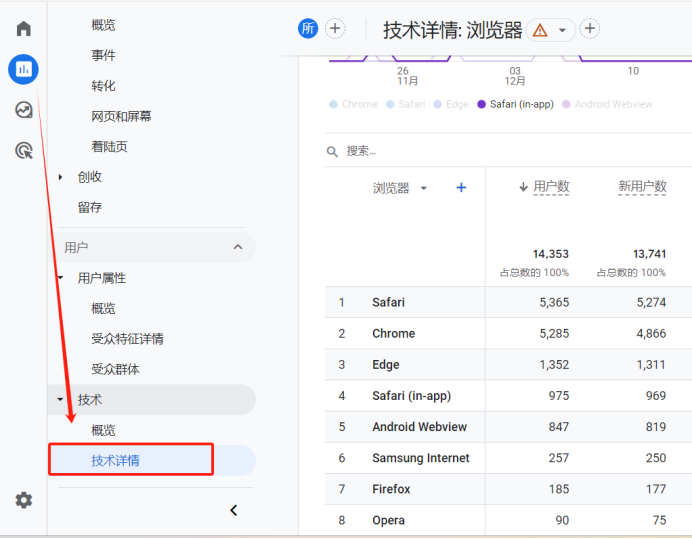
Through technical details, you can check which browsers, devices, and operating systems the user used to enter the website.
The powerful functions of Google Analytics 4 provide new possibilities for advertising optimization. Through in-depth study and flexible application of various functions of GA4, you will be able to gain more accurate insights into user behavior, optimize advertising strategies, and achieve greater advertising effects.
As a professional overseas marketing service provider with 14 years of experience, SEO-SEM can provide comprehensive marketing theory support and guidance on marketing methods for overseas platforms. If you have more questions or need more help, you can contact SEO-SEM at any time. !